Maths Exploration (IA) ideas
- Predicting fire spread in wildlife fields: This mathematical model of fire presented in this paper offers for the first time a method for making the quantitative evaluation of both rates of spread and fire intensity in fuels that qualify for the assumptions made on the model. The model didn’t use any prior knowledge of a fuel’s burning characteristic. It used only physical & chemical makeup of the fuel and the conditions in which it is expected to burn.
- Butterfly network in Computer Algorithm: A butterfly network is a blocking network and it does not allow an arbitrary connection of N inputs to N outputs without conflict. The butterfly network is modified in Benz network. The Benz network is a non-blocking network and it is generated by joining two butterfly networks back to back, in such a manner that data flows forward through one and in reverse through the other.
- Mercator’s Projection: The Mercator projection is a cylindrical map projection presented by the Flemish geographer and cartographer Gerardus Mercator in 1569. It became the standard map projection for nautical purposes because of its ability to represent lines of constant course as straight segments that conserve the angles with the meridians.
- Catenary Curve: The catenary is the shape of a perfectly flexible chain suspended by its ends and acted on by gravity. The catenary is the locus of the focus of a parabola rolling along a straight line. What makes the catenary arch important is its ability to withstand the weight. For an arch of uniform density and thickness, supporting only its own weight, the catenary is the ideal curve.
- Cissoid of Dicoles: Diocles(~250 – ~100 BC) invented this curve to solve the doubling the cube problem. The name cissoid (ivy-shaped) came from the shape of the curve. Later the method used to generate this curve is generalized, and we call curves generated this way as cissoids.
- Visual acuity: Comparison of Monoyar chart/Snellen chart/Jaggers chart/ Rosenbaum chart
- Affine Transformation: Affine transformation is a linear mapping method that preserves points, straight lines, and planes. Sets of parallel lines remain parallel after an affine transformation.
- Liu Hui’s π inequality: Liu Hui proved an inequality involving πby considering the area of inscribed polygons with N and 2N sides.
- Binet’s Formula: Binet’s formula is an explicit formula used to find the nth term of the Fibonacci sequence.
- Omar Khayyam’s solution of a cubic equation: To contemporary students, a geometric solution to a cubic equation may seem strange. Exploring this approach poses a challenge of communicating how geometric problems motivated the study of cubic equations.
- Bernstein Polynomial: Expansions in Bernstein polynomials have a slow rate of convergence. For that reason, following Bernstein’s application to the Weierstrass theorem, these polynomials had little impact in numerical analysis.
- Four-color theorem: The four color theorem states that any map–a division of the plane into any number of regions–can be colored using no more than four colors in such a way that no two adjacent regions share the same color. A four color theorem is particularly notable for being the first major theorem proved by a computer.
- Stoke’s theorem: Stokes’ theorem relates a surface integral of the curl of the vector field to a line integral of the vector field around the boundary of the surface.
- Logic gates, truth tables and simplification of circuits
- Thevenin’s theorem: How to analyse circuits using this theorem
- Norton’s theorem: Exploring Norton’s theorem in simplifying circuits along with laws of Boolean Algebra.
- Millman’s theorem and equation: Millman’s Theorem is nothing more than a long equation, applied to any circuit drawn as a set of parallel-connected branches, each branch with its own voltage source and series resistance.
- Bode diagram: Bode diagrams are graphical representations of the frequency responses and are used in solving design problems.
- Cayley-Hamilton Theorem: Explore the Cayley-Hamilton theorem in reducing the order of a polynomial or to determine analytic functions of a matrix.
- Length of a curve on a surface: Explore the length of a curve on a surface using Calculus.
- Covid-19: Explore the different timelines used by countries to stop the spread of Covid-19 virus. E.g. you can collect the data from WHO/countries and can come up with a graph which has exponential increase, has a peak and then starts decreasing. One such example is the graph of
. - AC & DC: Analyse the alternating current curve i.e. “sine” wave and direct current i.e.
and compare the “energy” and “power” generated by these curves and explore their uses.
- Parabola: Explore the various properties of parabola or ellipse. You need to draw these conic sections using software or geometric instruments and then verify the results e.g. (a) the circle circumscribing the triangle formed by any three tangents to a parabola passes through the vertex. (b) if a circle intersect a parabola in four points, their common chords will be equally inclined to the axis.
- Optical fibres and optoelectronic signalling: Calculate the advantages viz. low attenuation, analog & digital transmission, receiver sensitivity and disadvantages viz. tensile stress, fibre losses and other losses. Or how to do modulation and demodulation.
- Centre of percussion (applied mechanics): Calculate the centre of percussion for a baseball bat or a badminton racket and find the point of maximum impact when the ball or the shuttlecock hit at a certain angle/point.
- ISOCLINE: Graphs of solutions of a first order equation can be understood in terms of the slope field and isoclines. You can explore how to solve differential equations of the type . And consider the applications of such differential equations.
- Operational Amplifiers: Operational amplifiers are linear devices that have all the properties required for nearly ideal DC amplification and are therefore used extensively in signal conditioning, filtering or to perform mathematical operations such as add, subtract, integration and differentiation.
- BODE PLOT: In electrical engineering and control theory, a Bode plot is a graph of the frequency response of a system. It is usually a combination of a Bode magnitude plot, expressing the magnitude (usually in decibels) of the frequency response, and a Bode phase plot, expressing the phase shift.
- PROOFS: You can explore different ways of proving:
(i) The axiomatic method
(ii) Proof by cases
(iii) Proving an implication
(iv) Proving an “if and only if”
(v) Proof by contradiction
(vi) Proofs about sets
30. Hasse Diagrams: A Hasse diagram is a graphical representation of the relation of elements of a partially ordered set (poset) with an implied upward orientation. … If p<q in the poset, then the point corresponding to p appears lower in the drawing than the point corresponding to q.
31. Zipf’s Law: Modelling the distribution of the terms
It states that, if is the most common term in the collection, is the next most common, and so on, then the collection frequency of the ith most common term is proportional to :
32. Probabilistic Language models: Goal- compute the probability of a sentence or sequence of words
a) Unigram model
b) Bigram model
c) N-gram model
33. Markov chain/Markov assumption
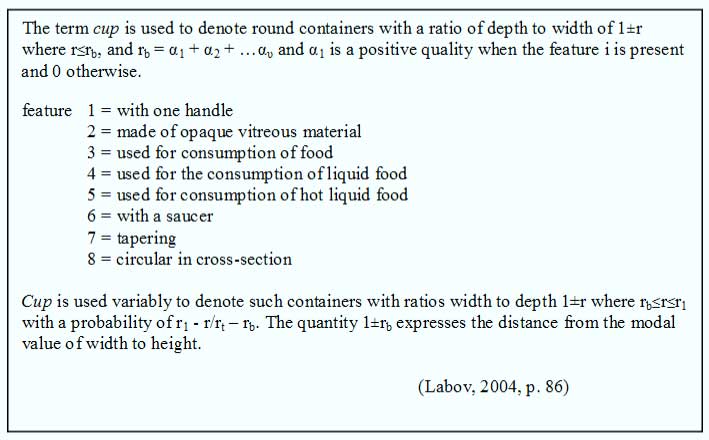
34. Labov’s definition of a cup:
35. The Shannon game: How many guesses to get the right word?