Practice Questions – Bivariate Statistics
1.
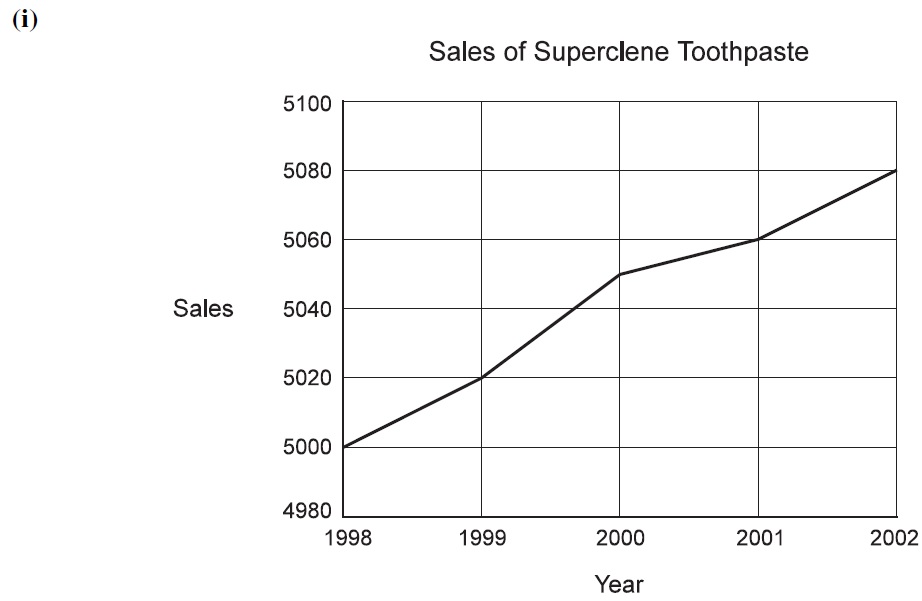
The diagram represents the sales of Superclene toothpaste over the last few years. Give a reason why it is misleading. [1]
(ii) The following data represent the daily ticket sales at a small theatre during three weeks.
52, 73, 34, 85, 62, 79, 89, 50, 45, 83, 84, 91, 85, 84, 87, 44, 86, 41, 35, 73, 86
(a) Construct a stem-and-leaf diagram to illustrate the data. [3]
(b) Use your diagram to find the median of the data. [1]

2. A random sample of 97 people who own mobile phones was used to collect data on the amount of time they spent per day on their phones. The results are displayed in the table below.
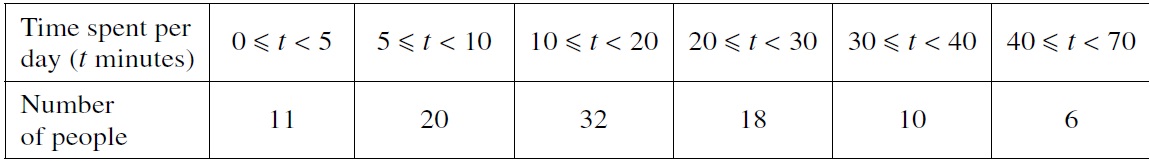 (i) Calculate estimates of the mean and standard deviation of the time spent per day on these mobile phones. [5]
(ii) On graph paper, draw a fully labelled histogram to represent the data. [4]

3. An experiment was conducted to investigate how the mass of a drug in a human body varies with time, measured from when the drug is given. The results are summarised in the following table.
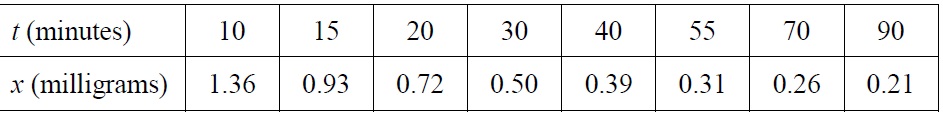
(i) Draw a scatter diagram for the data. [2]
(ii) It is desirable to predict the mass of the drug in the long run. Explain why, in this context, neither a linear nor a quadratic model is likely to be appropriate. [2]
(iii) It is decided that a model of the form
will be used. Calculate the least squares estimates of a and b and estimate the mass of the drug after two hours. [3]
(iv) Give an interpretation, in context, of the value of a. [1]

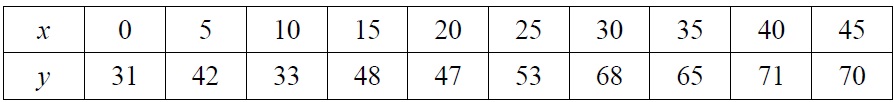
4. Eight randomly selected students were asked to indicate the number of hours they spent studying Mathematics per week during the June holiday. The corresponding Mathematics Mid-year examination scores marked out of 100 marks of the eight students were recorded. The eight pairs of data are given in the table below.
(i) Given that the regression line of
on
is
, find the value of p. [3]
Draw a scatter diagram to illustrate the data. Calculate the product moment correlation coefficient between
and
. [2]
(ii) Calculate the least squares estimates of
and
for the model
. Find the product moment correlation coefficient between
and
. [2]
(iii) Using your answers to parts (i) and (ii), explain which of
or
is the better model. [2]
(iv) Using the appropriate regression line, estimate the Mathematics Mid-year examination score of a student who spent 5.0 hours studying Mathematics during the June holiday. Comment on the reliability of your estimate. [2]

5. A particular hospital in Town A observed that the number of patients seeking medical treatment for respiratory problems has changed due to changes in air quality. The hospital decided to monitor the situation and the table below shows the results:

The least square regression line of
on
has equation
correct to 5significant figures.
The line passes through
and the mean pollutants index,
, is 104.75.
(i) Show that
. [2]
(ii) Draw a scatter diagram to illustrate the data. [2]
(iii) Explain, giving your reasons, why a model of the form
fits the data better. [1]
(iv) Using the model in part (iii), calculate the equation of the least square regression line and the value of
. [3]
(v) The hospital decided that they will need to purchase new equipment if the number of patients reaches 120. Explain, with reason, whether it is advisable for the hospital to purchase new equipment if the pollutant index is 150. [1]

6. May travels regularly from home to the hospital for treatment. She leaves home at minutes after 8 am and takes minutes to arrive at the hospital. Ten pairs of data are recorded in the table below.
(i) Draw a scatter diagram to illustrate the data, labelling the axes clearly. [1]
(ii) Calculate the equation of the least squares regression line of on and the value the linear product moment correlation coefficient for the data. [3]
(iii) Interpret the regression coefficient in the context of the question.[1]
(iv) Draw the regression line of on on the scatter diagram. [1]
(v) May has a hospital treatment appointment at 8.45 am on a particular day. If she leaves home at 8.10 am, explain whether she is likely to be on time for her hospital treatment. Comment on the reliability of your answer. [3]
