IBDP Past Year Exam Questions – Transformation
Q1. [N10.P2]
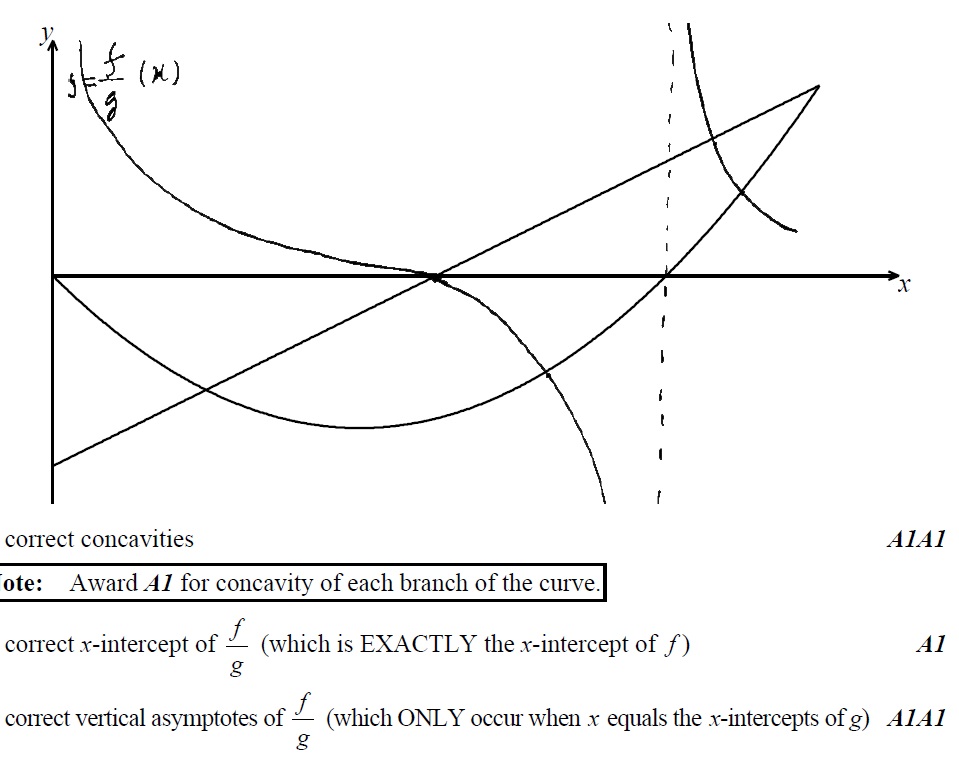
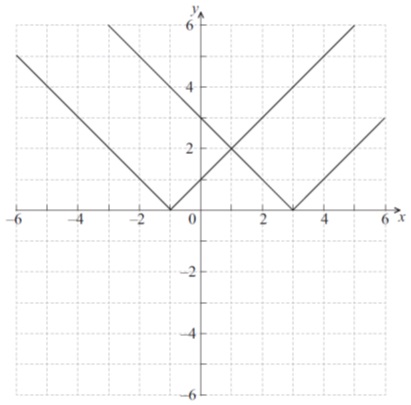
The diagram shows the graph of a linear function and a quadratic function
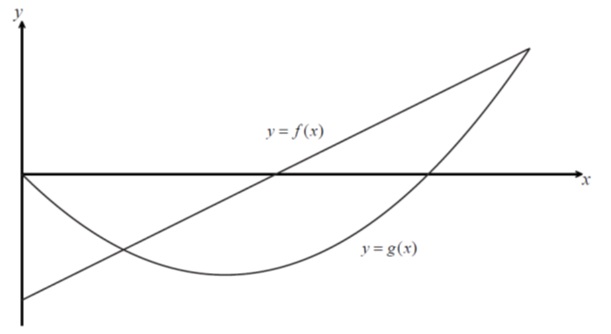
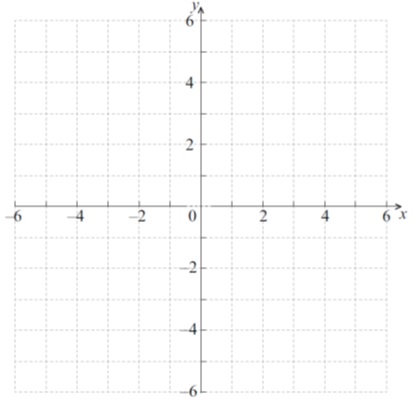
On the same axes sketch the graph of . Indicate clearly where the x-intercept and the asymptotes occur. [5 marks]
Q2. [M08.P2.TZ2]
The graph of for is shown.
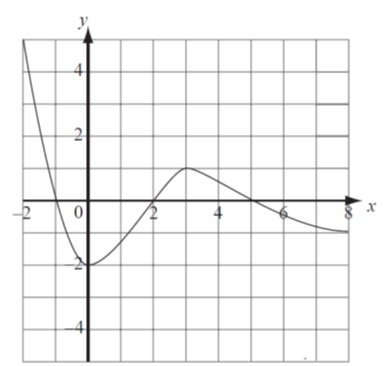
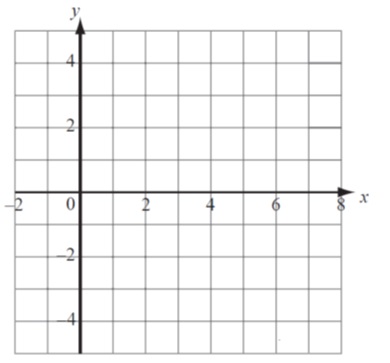
On the set of axes provided, sketch the graph of , clearly showing any asymptotes and indicating the coordinates of any local maxima or minima. [5marks]

Q3. [M09.P2]
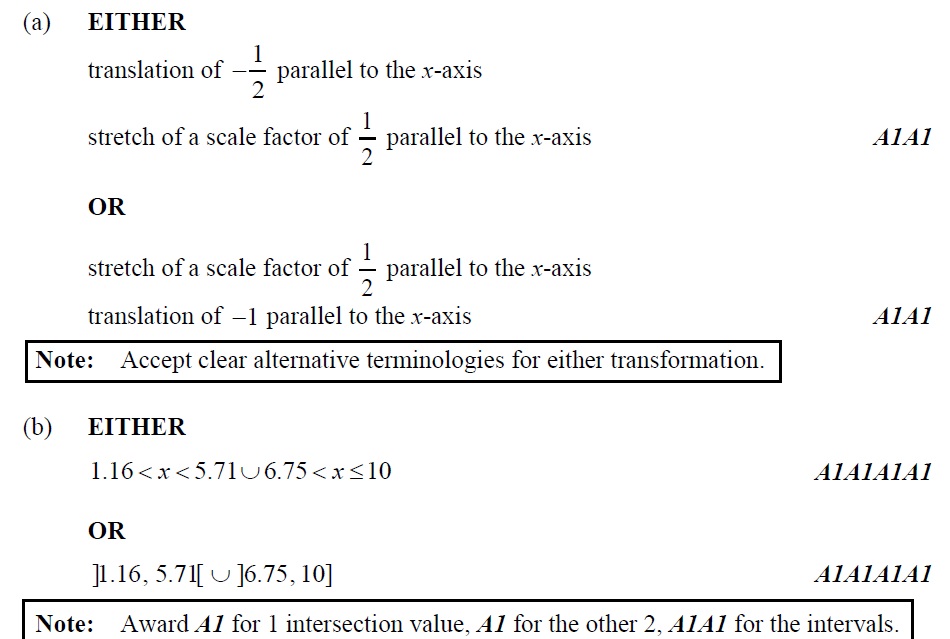
(a) The graph of is transformed into the graph of . Describe two transformations that are required to do this. [2marks]
(b) Solve . [4 marks]
Q4. [M15.P2]
The graph of is obtained from the graph of by a translation of units in the direction of the x–axis followed by a translation of units in the direction of the y–axis.
(a) Find the value of and the value of . [4 marks]
Q5. [M12.P2]
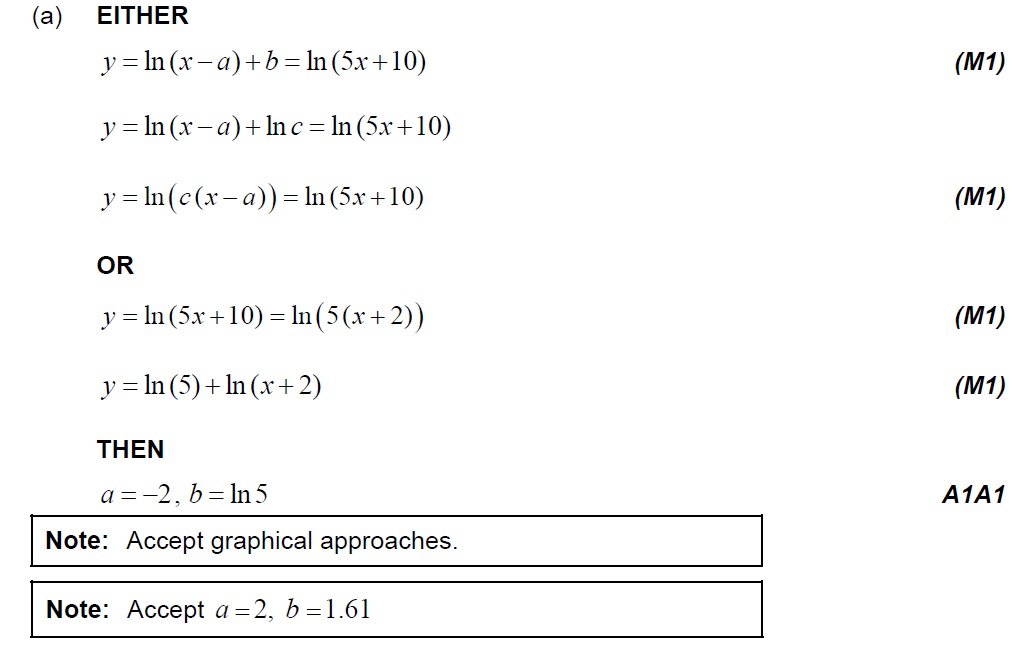
Let . The graph of is transformed into the graph of the function by a translation of , followed by a reflection in the x-axis. Find an expression for , giving your answer as a single logarithm. [5 marks]

Q6. [N14.P1]
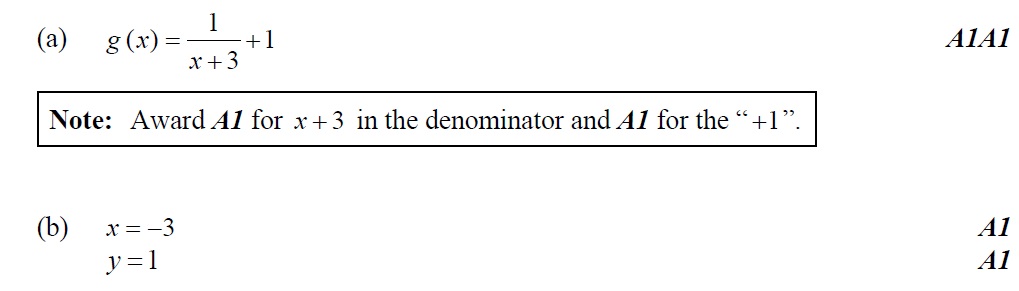
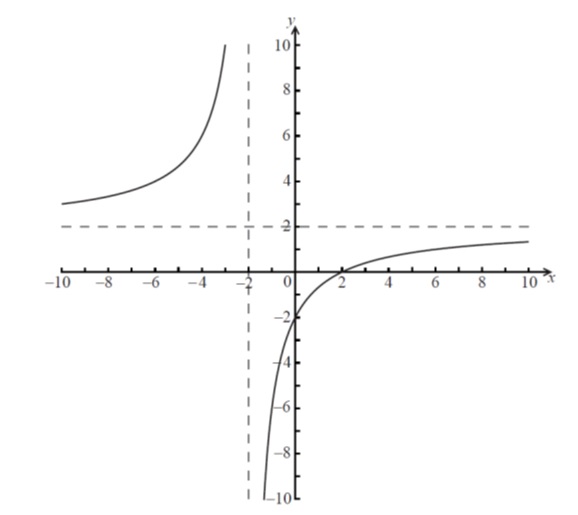
The function f is defined by . The graph of the function is obtained by applying the following transformations to the graph of :
a translation by the vector ;
a translation by the vector ;
a translation by the vector .
(a) Find an expression for . [2 marks]
(b) State the equations of the asymptotes of the graph of . [2 marks]
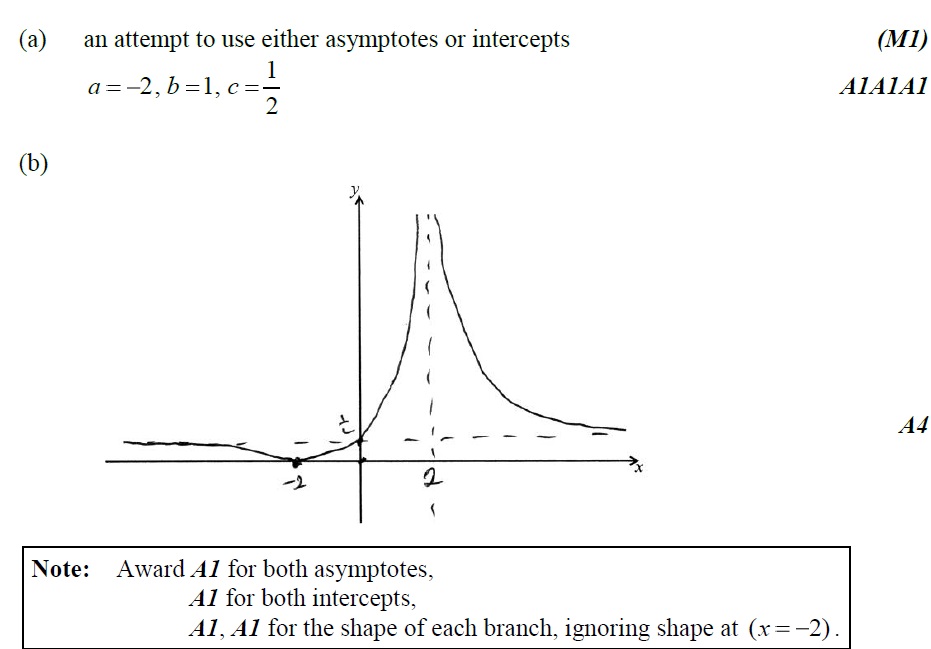
Q7. [M10.P1]
The graph of is drawn below.
(a) Find the value of , the value of and the value of c . [4marks]
(b) Using the values of and found in part (a), sketch the graph of on the axes below, showing clearly all intercepts and asymptotes.
Q8. [M11.P1.TZ1]
The diagram below shows the graph of the function , defined for all , where .
Consider the function .
(a) Find the largest possible domain of the function . [2 marks]
(b) On the axes below, sketch the graph of . On the graph, indicate any asymptotes and local maxima or minima, and write down their equations and coordinates. [6 marks]
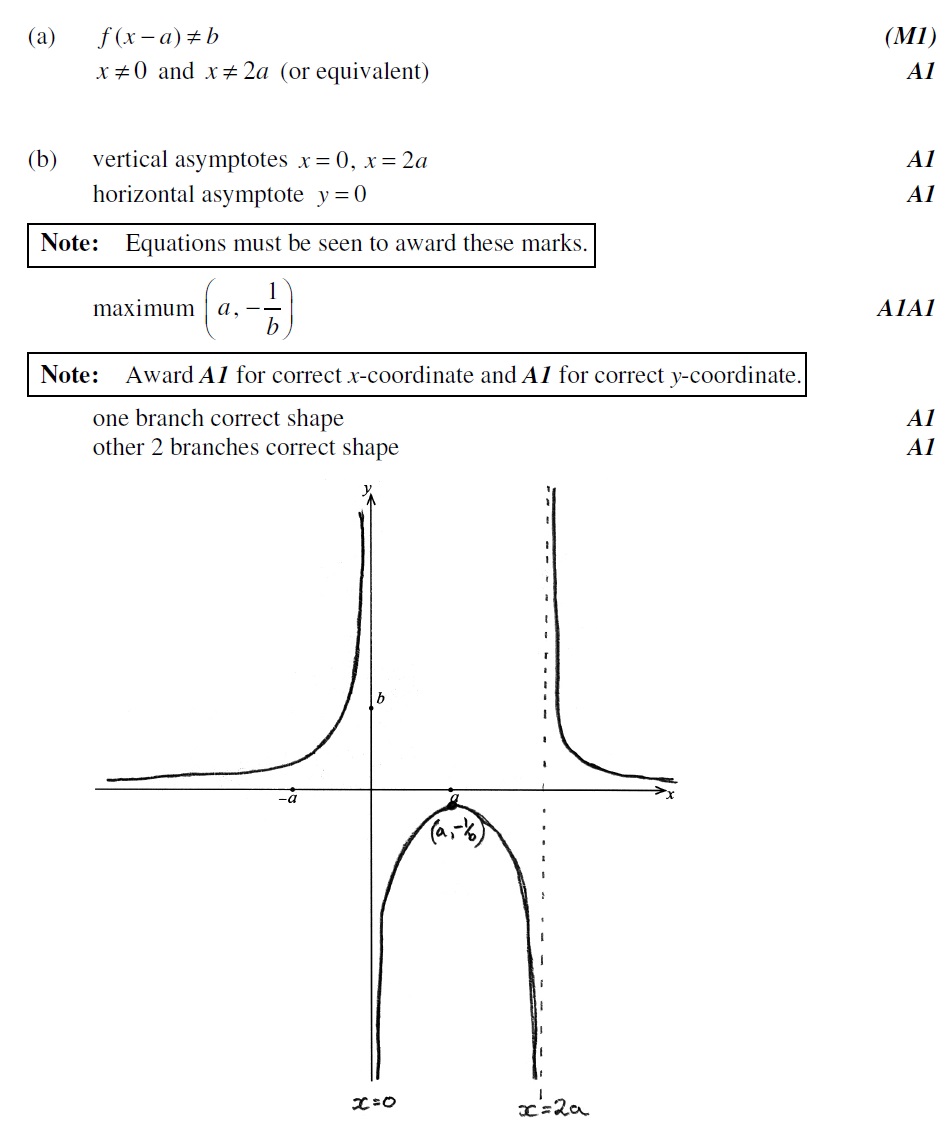
Q9. [M12.P1]
The graph of is shown below, where A is a local maximum point and D is a local minimum point.
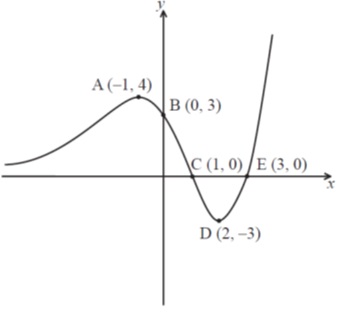
(a) On the axes below, sketch the graph of , clearly showing the coordinates of the images of the points A, B and D, labelling them and respectively and the equations of any vertical asymptotes. [3 marks]
Q10. [M11.P1.TZ2]
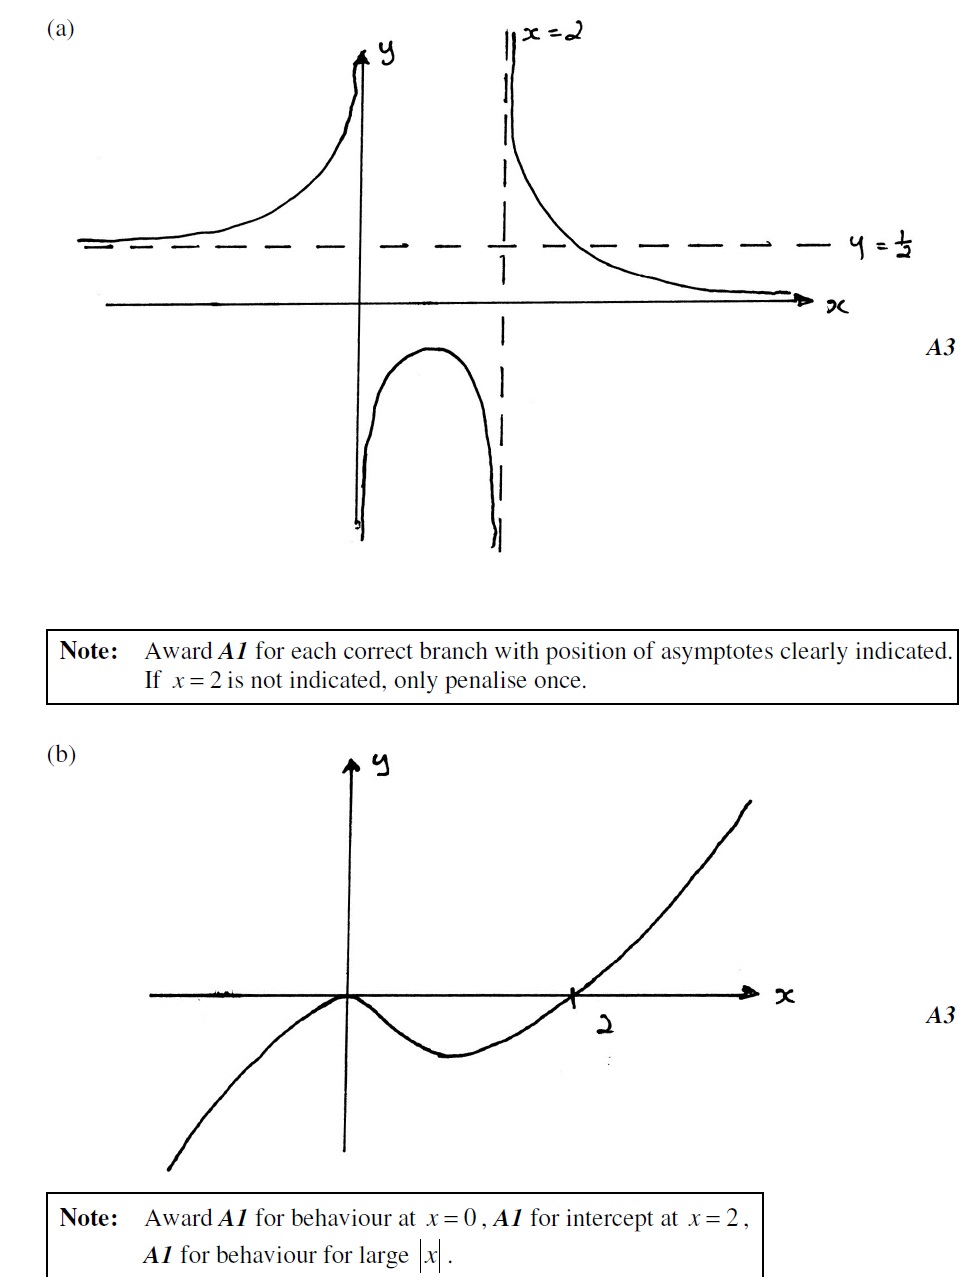
The diagram shows the graph of . The graph has a horizontal asymptote at .
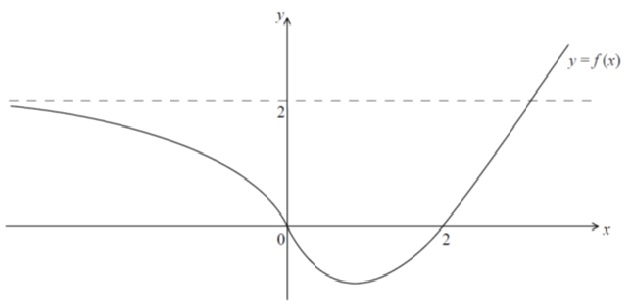
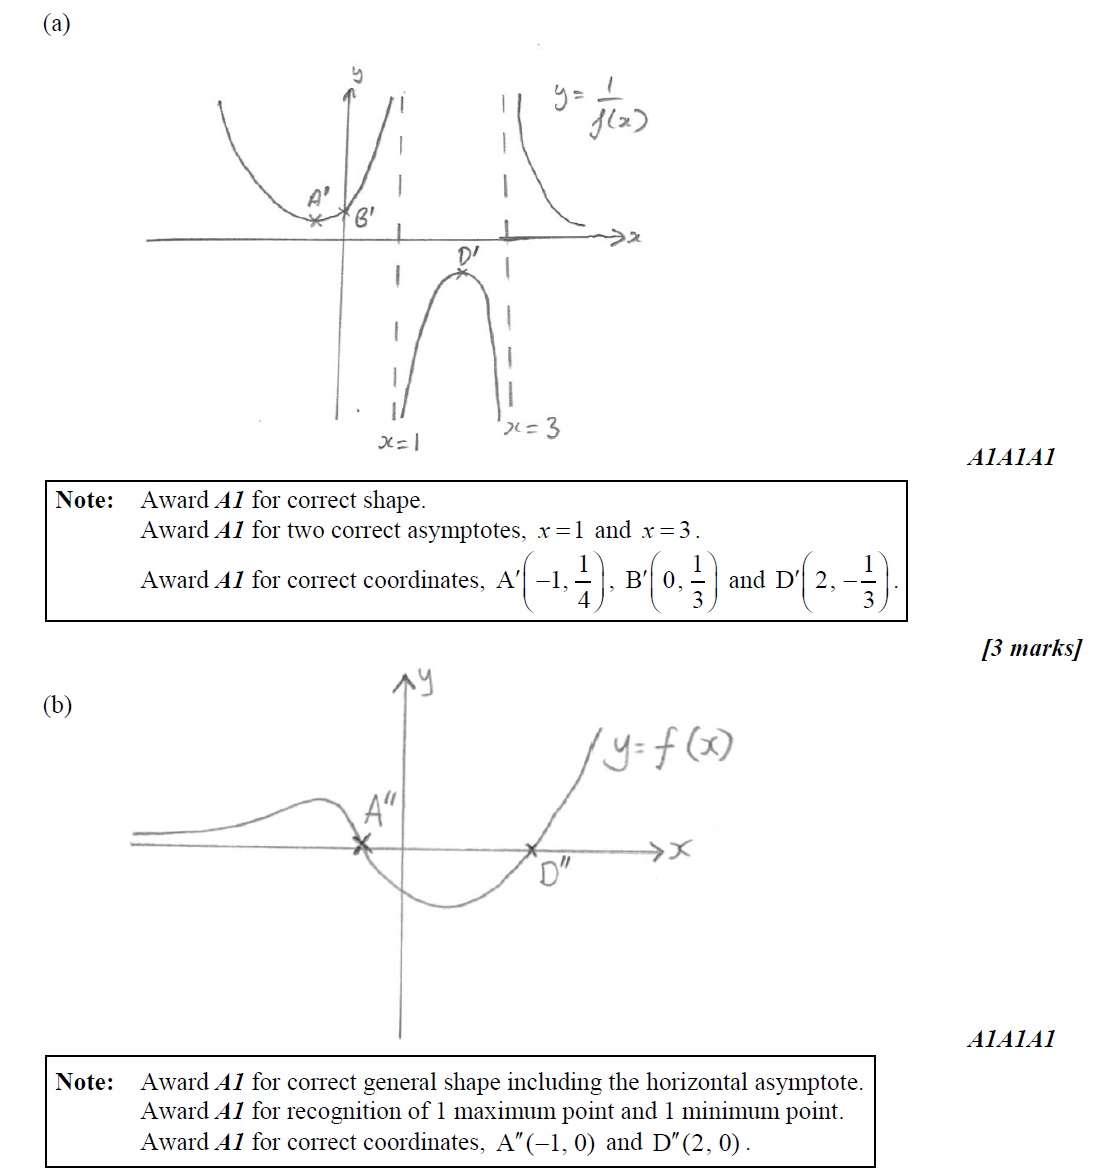
(a) Sketch the graph of . [3 marks]
(b) Sketch the graph of . [3marks]
Q11. [M12.P1.TZ1]
The graphs of and are shown below.
Let .
(a) Draw the graph of on the blank grid below. [4 marks]

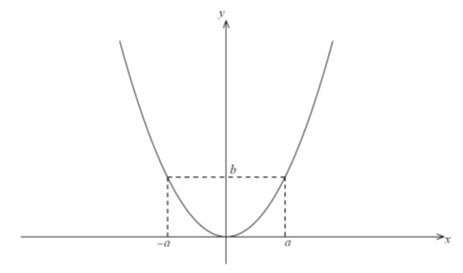
Q12. [M08.P2]
Let , where . The diagram shows the graph of .
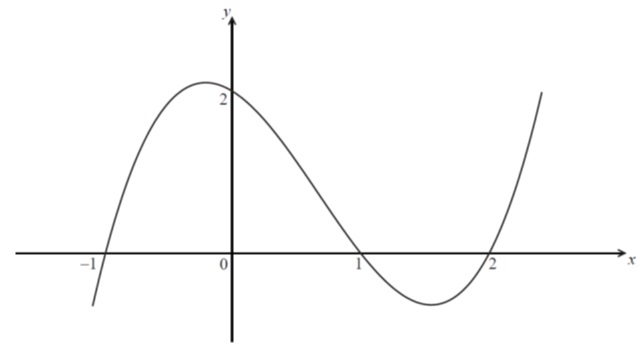
(a) Using the information shown in the diagram, find the values of . [4 marks]
(b) If ,
(i) state the coordinates of the points where the graph of intercepts the x-axis.
(ii) Find the y-intercept of the graph of g . [3 marks]